Leapfrog - Research Note
What the machine does, what was changed on the way to the shipped version, and what each change did - with the tests that decided it.
Version 1.30 - October 2026
All figures in this note are Strategy Tester runs on real broker ticks at 100 percent history quality. They are backtest figures, not results from live trading. Every number names the build, the broker feed and the window it came from; a number that cannot be traced that way does not appear here. Profit factors below 1.5 and single results below break-even are not quoted here even where they were measured; the underlying finding is still described in words.
0. The result in one table
Version 1.30, compiled defaults. Backtest, MetaTrader 5 Strategy Tester, real ticks at 100 % history quality, 10,000 starting deposit, 2 January 2024 to 26 September 2026, three live broker feeds (Vantage's real-tick history starts in July 2025, so its row covers July 2025 on):
| feed | net | % of deposit | profit factor | trades | relative equity drawdown |
|---|---|---|---|---|---|
| Fusion - the published figure, the weaker of the two feeds that cover the whole window | 20,200.33 | +202.0 % | 1.66 | 3,922 | 7.30 % |
| BlackBull | 21,314.77 | +213.1 % | 1.77 | 3,909 | 5.73 % |
| Vantage (from July 2025) | 11,081.91 | +110.8 % | 1.80 | 2,098 | 5.87 % |
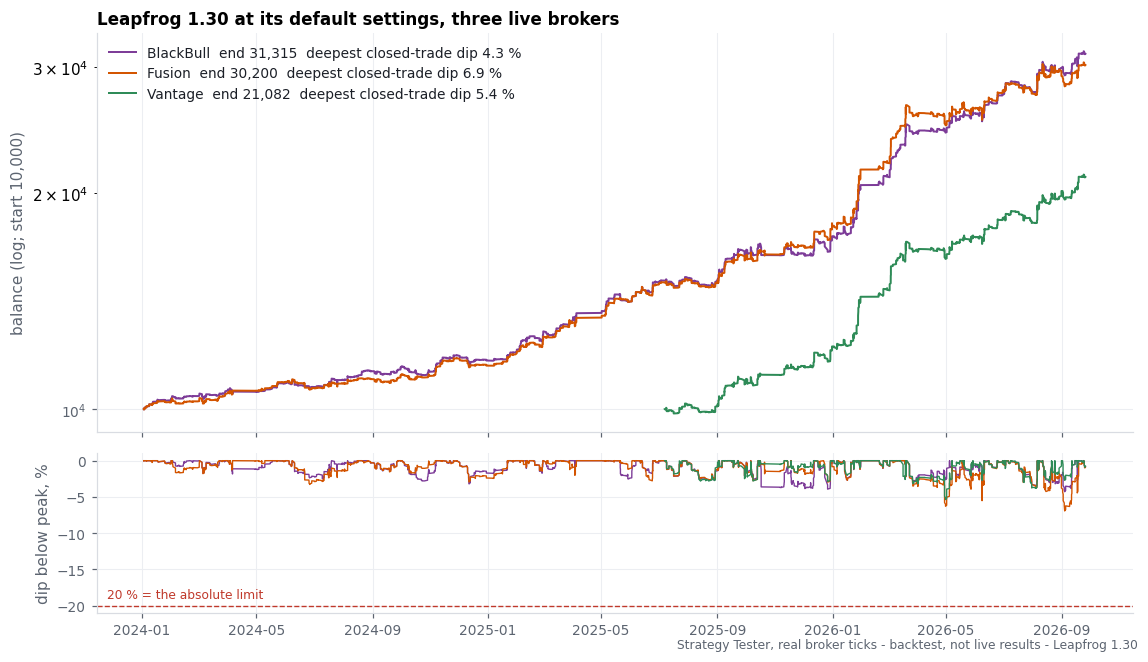
Pepperstone, used in earlier measurements, is left out of the current figures: its real-tick archive on our test terminal has gaps in 2026, and a figure built on filled-in ticks is not published.
Earlier measurement
Leapfrog runs out of the box on its compiled defaults - no .set file is needed. One binary, four live broker feeds, 10,000 starting balance, the same fourteen-month window (1 July 2025 to 7 September 2026):
| feed | net | profit factor | equity drawdown |
|---|---|---|---|
| Vantage Markets | +9,749 (+97%) | 1.74 | 5.9% |
| Pepperstone EU | +9,241 (+92%) | 1.65 | 7.9% |
| BlackBull Markets | +8,449 (+84%) | 1.67 | 5.1% |
| Fusion Markets | +8,260 (+83%) | 1.58 | 6.7% |
These four rows were measured on version 1.20 of the engine. Every version since is proved to place the same deals as the version before it under the shipped defaults, an unbroken chain to the current 1.28. A Strategy Tester check run directly on the 1.28 binary agrees: BlackBull, 1 April 2025 to 19 September 2026, 2,388 trades, net +12,261.24, profit factor 1.77, equity drawdown 5.29%.
On OANDA GOLD.pro - a demo account, and the one feed whose tick archive reaches back to 2018, used here only to test survival through a full market cycle rather than as a headline - a Strategy Tester run of the same defaults stayed net positive across the 2018-2026 window at an equity drawdown under 10%. That full-cycle view is also where the honest limit of this system shows up, and section 7 states it plainly.
How the machine got from a raw multi-window range idea to that table is the rest of this note. Each section names a mechanism, shows the figure that decided it, and states what it did to losses and to profit. The exact geometry (distances, windows, thresholds) is deliberately not written out here; it is in the product's inputs.
1. How it was tested
Before the mechanisms, the rules the testing followed - because the numbers are only worth what the method is worth.
- Real ticks only. Every claim comes from a tester run on a broker's own tick archive at 100% history quality. The engine's ladders trade off intraday highs and lows, which is exactly the kind of level a one-minute-OHLC search misreads.
- One compiled binary, several feeds. Pepperstone, Vantage, Fusion, BlackBull and a demo feed see the same gold market through different cost paths. Agreement across the live ones shows a mechanism survives the broker; the demo feed is used only for reach - it is the one archive that covers the full 2018-2026 cycle.
- Parity before a claim. Each version change was proved to place the same deals as the version before it, deal for deal, on a real-tick window, before any figure from the new version was published. The chain from 1.20 to the current 1.28 is unbroken.
- Predict, then run. Each mechanism change stated its expected effect before the run. Where the effect did not appear, the change was dropped or rebuilt rather than tuned until it looked better (section 6).
- Look at it. No verdict was passed on a statistic alone; every candidate mechanism was also read on the equity curve and on the chart with the ladders' own resting orders drawn.
2. The base mechanism: five rolling ranges, not one
Gold's daily and multi-day ranges are not fixed; they expand and contract with the market's own state. Leapfrog does not pick one "the" range. It runs five ladders side by side, each one watching the highest high and lowest low of its own rolling window - windows from about one day up to about four trading weeks - and rests a stop order a small percentage of price beyond that window's current edge. A genuine break of the range fills the order in the direction of the move; the order is re-aimed as the range itself moves, and placed only at fixed clock slots rather than on every tick, so the machine is not fighting its own orders tick by tick.
Because the five windows resolve on different clocks, the ladders behave like a small portfolio rather than one system: in most months some are active while others wait for their own range to set up. Each ladder holds at most one position per side, there is no averaging down, no grid and no martingale, and a losing position is closed at its stop.
Backtest, MetaTrader 5 Strategy Tester, real ticks, OANDA GOLD.pro, 2018 to 2026 (full-cycle, position level).
The win rate is a geometry, not a skill. An early read of this record quoted a 51% win rate; that count included partial closes as separate trades. Read at the position level - one open-to-close position is one result - the true hit rate is about 23%, with an average winner near $23.89 against an average loser near $6.65 (fixed-lot terms). A breakout system with a stop close to the range edge and a target several multiples of that stop wins a minority of the time by design; the 23% is the shape of the payoff, not a flaw in the entry.
3. Preventing losses: reading gold's own recent volatility
A range-breakout system has two natural failure modes, at opposite ends of the same axis. When volatility explodes, an order fills into a move that runs straight past its stop before the position can be managed. When volatility collapses, the range edges sit inside the noise and a "break" is just the noise crossing a line that was never a real level.
Two controls address this, and both compare gold to its own recent history rather than to a fixed number, so neither needs retuning as gold's price level changes:
Daily stand-down. New orders are not armed when the previous day's average true range sits at either extreme of its own trailing 250-day distribution - the very top or the very bottom. Measured across the full tick record, daily profit and loss by that percentile is a U-shape, not a slope: the middle of the distribution is where the range-breakout mechanism earns, and the top percentile - the small slice of days where volatility is already exploding - is the one slice that loses money on average. Standing down on that slice, and on the quietest slice where a "break" is mostly noise, removes a loss concentrated in a small number of days without giving up the ordinary middle of the distribution.
Hourly channel-width sizing. The width of the hourly rolling channel, again read as a percentile of its own recent history, scales position size on a curve rather than a switch: narrow-channel conditions are traded smaller, not skipped. Across four ladders measured independently, this axis ranked among the strongest of over two hundred candidate indicators tested for the same purpose, and it was sign-stable across every non-overlapping slice of the record - the reason it is a continuum rather than a binary skip is that even the narrowest-channel trades keep earning in a trending market, just less; a hard skip would have discarded some of that.
4. Finding, and fixing, a filter that looked right and read wrong
An earlier version shipped an input read as "only arm when the day is expanding" - a sensible-sounding rule. Reading the code against the tester journal showed it did something different: it let the order fill first, then closed the position immediately if the day turned out not to be expanding after all. Every rejection this way still paid the full cost of a fill and a close. It fired on a sizable share of all fills and it cut into the winners specifically - the position-level win rate with it running was well under the win rate without it.
Turning it off, and later rebuilding it correctly on the arming side rather than the fill side, was tested both ways. The correctly-built arming-side version recovers the wasted cost of the old behaviour but still gives up the drawdown reduction that comes from having no such filter at all - the underlying measure (how much of a day has elapsed against how much range has appeared so far) looks quiet early on a day that later turns out to be exactly the kind of day the ladders exist to catch. Both forms are kept as documented, off-by-default options; neither is the shipped configuration.
5. The exit: partial profit-taking and a trail, in R multiples
Once a ladder's position is ahead, the exit engine closes part of it in three stages and trails the stop behind the best price reached, all measured in multiples of the position's own initial stop distance (R) rather than a fixed dollar amount - so the same exit logic scales sensibly whether a ladder's stop is a fraction of a percent of price or closer to one percent. This keeps a share of every winning move while giving the position room to extend past the first profit mark rather than capping it there.
6. What was tested and rejected
So that the reader knows what is not in the box, and why - described here without the specific figures, which belong to the internal research record rather than the public one:
- Sizing by the last completed break's outcome. An earlier form of the engine showed its profits arriving in runs, which suggested sizing up after a win and down after a loss. On the current engine, with the volatility controls of section 3 already in place, that clustering is gone: a corrected statistical test found no dependence between consecutive outcomes, and turning the sizing rule on cost money on every live feed it was tried on. It ships off.
-
Dropping the two ladders with the largest full-cycle drawdown contribution. Recommended more than once from the long record, this was tested directly and reversed: nearly all of each ladder's full-cycle loss traced to a small cluster of extreme-volatility trades that the section 3 controls now stand down on. With those controls active, both ladders are net positive across every slice of the record tested, and removing them gives up a large share of total profit for a small reduction in the worst weeks.
-
A second-attempt entry after a failed break reverses back through the level. Tested as a research option; it is not part of the shipped configuration. It is kept in a research-only build for further work rather than discarded outright.
- A staged genetic search over entry parameters, validated forward. The search converged on shorter-window variants of the ladders that looked better in-sample; on an untouched forward window they traded far more often at a lower quality of fit to the underlying signal. The shipped ladder windows were kept. A parallel search over the exit parameters showed the same pattern - better in-sample, worse on the forward window by every measure except raw net - and the shipped exit was kept as well.
7. The honest limit: this is a regime-dependent system
The mechanism in section 2 needs a range to break. Measured across the full 2018-2026 tick history on the one feed that reaches back that far, the years of small, quiet daily ranges produced little for this system to catch, and the two volatility controls in section 3 were built specifically to take the cost of trading through those years from a loss down to close to flat, rather than to make the engine indifferent to the regime. They narrow the regime-dependence; they do not remove it.
Backtest, MetaTrader 5 Strategy Tester, real ticks, Vantage / Pepperstone / BlackBull / Fusion, 2025-07-01 to 2026-09-07 (section 0's table).
The return in the table in section 0 is concentrated in the more recent stretch of the record, where gold's daily ranges have been larger and more frequent. That is not a coincidence: it is the mechanism in section 2 working in the conditions it needs. A buyer should expect the same pattern going forward - flatter stretches in a genuinely quiet gold market, and the system doing its work when gold's ranges expand - rather than a constant rate of growth in every kind of market.
8. Limits
- Leapfrog earned its result in a market of expanding daily and multi-day gold ranges and goes quiet, not negative, when that condition is absent for an extended period (section 7).
- The figures are backtests on tick archives. Live spreads, slippage and a broker's own fills differ from the archive's; use a raw-spread or ECN account, and reproduce a short recent window on your own broker before trading it (product manual, "Reproduce the tests yourself").
- Growth figures at the shipped lot-per-equity setting (backtest, Strategy Tester, real ticks, Vantage / Pepperstone / BlackBull / Fusion, 2025-07-01 to 2026-09-07) include the compounding of one fourteen-month window from a 10,000 start; a different start date inside the same window moves the growth number more than it moves the drawdown number, which is why drawdown is reported alongside every growth figure in this note.
- Past performance does not indicate future results. Test on a demo account with your broker before trading real funds.
Appendix - traceability
| version | change | proof |
|---|---|---|
| 1.10 line | daily volatility stand-down and hourly channel-width sizing added | improved the result on every live feed tested against the ungated binary, four feeds |
| 1.20 | a mis-built "day expanding" filter (fill-then-close) found and disabled | full-cycle position-level hit rate measurably higher with it off; the full-cycle result improved on every measure |
| 1.21 | internal reliability fixes (a trade call moved out of a transaction handler; a magic-number filter widened) | proved neutral: same deals as before the fix, deal for deal |
| 1.22 | streak-based sizing added as an off-by-default option | measured null on the shipped configuration; independence confirmed by a corrected statistical test; ships off |
| 1.24 | trade requests no longer sent while the market session is closed | proved neutral: same deals, deal for deal |
| 1.25 | Account type input added (Personal / Prop firm 2-step / Prop firm 1-step) | Personal default proved neutral against 1.24; prop modes proved to match the equivalent manual lot setting, deal for deal |
| 1.26 | prop-firm rule engine added (daily loss, maximum loss, target, best-day cap, Friday close) | with every rule off, proved neutral, deal for deal; each rule proved to trigger correctly at its threshold |
| 1.27 | research-only switch for a post-loss re-entry idea (section 6) | shipped behaviour unchanged; research build only |
| 1.28 | Inputs tab reorganised behind Settings: Recommended / Custom; unused inputs removed from the visible tab | proved neutral against 1.26, deal for deal, on an independent real-tick window |
Every table in this note names its feed and window; the compiled binary that produced each row is recorded by its hash in the product manifest.