Captain Karat-Smash — Research Note
What the machine does, what was changed on the way to the shipped version, and what each change did — with the tests that decided it.
Version 1.11 · October 2026
All figures in this note are Strategy Tester runs on real broker ticks at 100 % History Quality, compiled defaults, 10,000 starting deposit unless stated otherwise. They are backtests and do not represent trading on a live account. Every number names the build, the broker feed and the window it came from; a number that cannot be traced that way does not appear here.
0. The result in one table
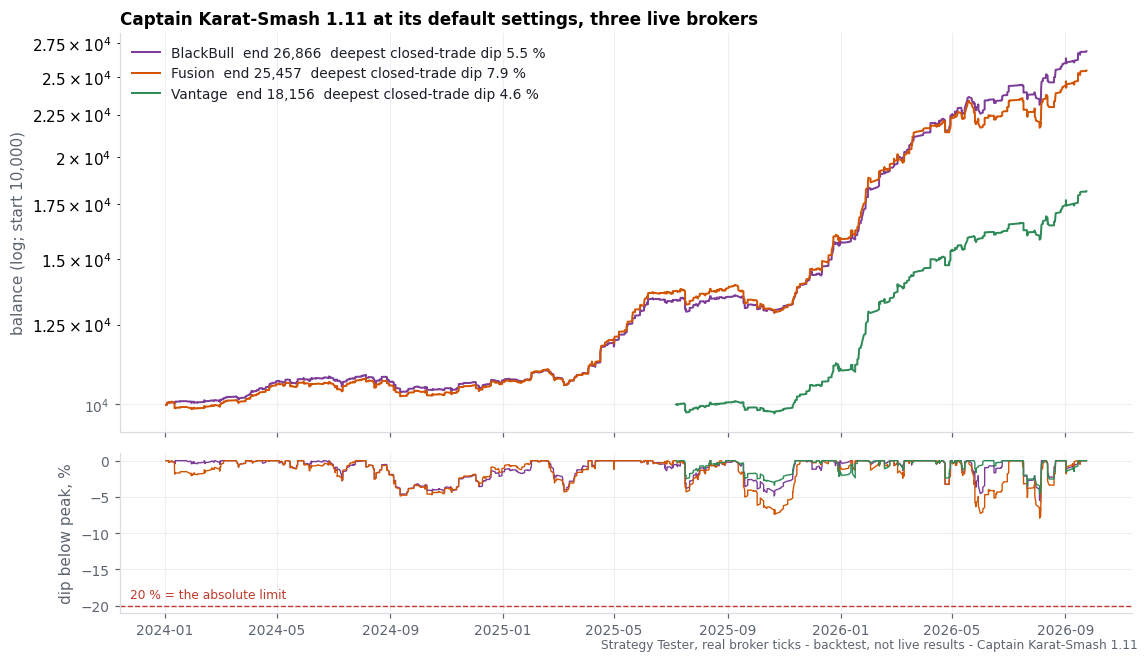
Version 1.11, compiled defaults. Backtest, MetaTrader 5 Strategy Tester, real ticks at 100 % history quality, 10,000 starting deposit, 2 January 2024 to 26 September 2026, three live broker feeds (Vantage's real-tick history starts in July 2025, so its row covers July 2025 on):
| feed | net | % of deposit | profit factor | trades | relative equity drawdown |
|---|---|---|---|---|---|
| Fusion - the published figure, the weaker of the two feeds that cover the whole window | 15,456.67 | +154.6 % | 1.88 | 2,119 | 8.72 % |
| BlackBull | 16,866.36 | +168.7 % | 2.16 | 1,933 | 6.32 % |
| Vantage (from July 2025) | 8,155.62 | +81.6 % | 2.55 | 727 | 5.19 % |
Pepperstone, used in earlier measurements, is left out of the current figures: its real-tick archive on our test terminal has gaps in 2026, and a figure built on filled-in ticks is not published.
Earlier measurement
Captain Karat-Smash runs out of the box on its Medium risk level. One 14-month window run identically on four live broker feeds, compiled defaults, 10,000 starting deposit (backtest, MetaTrader 5 Strategy Tester, real ticks, 2025-07-01 to 2026-09-07):
| feed | net | % of deposit | profit factor | trades | equity drawdown |
|---|---|---|---|---|---|
| Fusion (worst qualifying live feed) | 4,935.14 | +49.4 % | 1.73 | 896 | 7.88 % |
| Vantage | 5,184.50 | +51.8 % | 2.14 | 705 | 5.65 % |
| BlackBull | 5,234.33 | +52.3 % | 1.99 | 786 | 5.99 % |
| Pepperstone | 6,907.96 | +69.1 % | 2.11 | 924 | 6.56 % |
| OANDA (demo, spread-survival check only) | 7,618.23 | +76.2 % | 1.76 | 902 | 9.71 % |
The published claim is the worst of the four live feeds, Fusion. Read as: the same seven-strategy machine takes closely related trades on every broker and still earns different money on each one, which is the honest range rather than a defect. How the machine got from a raw idea to that table is the rest of this note.
1. How it was tested
Before the mechanisms, the rules the research followed, because the numbers are only worth what the method is worth.
- Real ticks decide; one-minute bars only search. A calendar-shift control on one-minute bars first confirmed the pattern was tied to the price bars rather than to dates, which made the bars a valid search instrument; every figure that is claimed anywhere in the product line came from a real-tick run.
- Feed-matched, cross-checked. The level object, the stop and target percentages and the exit machine were each measured independently on BlackBull's multi-year archive and cross-checked against Fusion, Pepperstone and Vantage before being written down as a constant. A constant that only held on one feed was not shipped.
- Controls, not assertions. A random level at the same distance and cadence as the real one, a bracket-only exit with the stop-lock removed, and a stop-lock with the trail removed were each run as separate arms so the contribution of each part of the machine could be isolated rather than assumed.
- Parity before shipping. The product build was gated on reproducing the research engine's own trades exactly, not on "looks similar": in a Strategy Tester backtest at a fixed 0.01 lot the product reproduces the research build's seven-strategy leg fill for fill (1,293 fills, entry match 1.0000, net matched to the cent, Pepperstone 2025-01-02 to 2026-09-05). Every later version change was proved the same way before release — deal for deal against the version before it, on a real-tick window, before the change shipped.
- An untouched out-of-sample era. The strategy constants were measured on 2022-2026 data from three brokers. A fourth broker's eight-year archive, which reaches back to 2018, was set aside as a genuine out-of-sample test rather than used to fit anything (section 6).
2. The base mechanism: one object, seven strategies
Captain Karat-Smash is a level-break system. Before a burst, gold sits under a recent high or above a recent low it has not managed to close through — an unbroken swing. Seven strategies run side by side on one chart, each watching that same kind of object on its own timeframe (two on daily bars, five on four-hour bars), each with its own entry offset inside the level and its own bracket:
- Level. A swing is a bar whose high or low is more extreme than the bars on both sides of it, and which no closed bar has since traded through.
- Entry. A stop order rests a small, strategy-specific percentage of price inside the level, so price has to carry through the level to trigger the order — a break, not a touch.
- Bracket. Every fill receives a stop loss and a take profit set as a percentage of the entry price. Because the geometry is proportional to price rather than a fixed dollar distance, it reads the same whether gold trades near 1,800 or near 4,300 — confirmed by measuring the same percentages holding constant, to two decimal places, across sixteen calendar quarters and four different price eras.
- Exit. Once a trade is far enough ahead its stop locks, then trails behind each closed one-minute bar and is never loosened. Two of the seven strategies also pull their target closer when a trade goes far enough against them, so they can leave on a bounce instead of riding to the full stop.
What the level is worth. A control that replaces the real level with a random price at the same distance and the same placement cadence keeps only a minority of the net that the real level earns, on two independent random seeds. The level is the source of the edge; the bracket geometry alone is not enough.
Nine variants, seven shipped. The underlying research identified nine timeframe-and-strictness variants of this one object. Two were set aside on causal, not curve-fit, grounds: one earned a few cents on average across nearly two thousand trades — practically inside the noise of trading costs — and lost money in the quiet and middling-volatility thirds of the sample; the other traded only a handful of times a year and lost money in two of the three volatility thirds. The seven that shipped were each profitable in at least two of the three volatility thirds, several in every one.
3. Building the exit: bracket, then lock, then trail
The bracket alone is not the finished machine. Three exit arms were compared on identical entries:
- Bracket only (stop and target, nothing else) earns a little more in isolation, but at several times the drawdown of the machines below — the raw stop and target are not enough on their own.
- Stop-lock plus trail — once a trade is far enough ahead the stop moves to a small locked profit, then trails behind each closed one-minute bar and never loosens — cuts that drawdown far more than it costs the net. This is the shipped exit for five of the seven strategies.
- Trail without the lock stage (Strategy Tester backtest, BlackBull and Pepperstone real ticks, 2025-2026) looked like a candidate improvement in isolation (more net at a similar or lower drawdown on some feeds), but the gain lived almost entirely in the two strategies that were excluded from the roster in section 2. On the shipped seven strategies, the worst-feed ratio of net to drawdown was lower without the lock than with it, so the lock stays — decided on the worst feed, not the most favourable one.
A separate control removed the trail entirely and let every position ride to its bracket stop or target: this also raised net but at a large multiple of the drawdown, which is why the close-anchored trail is the shipped risk control rather than an option.
Per-tick versus per-bar trailing. A per-tick version of the same trail moved most exits earlier by roughly two minutes on average, but the net effect across the trade population was negligible. The one-minute-close trail is what ships — cheaper to compute and no worse for it.
3.1 Version 1.07-1.09: widening and conditioning the trail
Three further changes were made to the trail after the roster and lock-then-trail exit were fixed, each proved deal-for-deal against the version before it on a real-tick window before release:
- 1.07 — a wider trail on four of the seven strategies. (Strategy Tester backtest, BlackBull, OANDA, Fusion and IC Markets real ticks, 2023 to 2026.) The original trail was found to close winners too early in quiet stretches; doubling its distance on strategies 3, 4, 6 and 7 earned more net on every one of the four broker feeds tested, and on the longest-history feed its worst drawdown episode also recovered faster. A trail wider still earned a little more again but took several times longer to recover from its worst episode, so it was not chosen.
- 1.08 — the trail follows the daily trend. The wider 1.07 trail helps trades that move with the daily trend and costs a little on trades against it, because a counter-trend break tends to snap back. From 1.08, a position opened against the prior day's trend keeps the tighter, pre-1.07 trail; a position with the trend uses the wider one. Measured on four broker feeds, this raised net on every one and shrank the worst five-day stretch at equal profit on every one.
- 1.09 — a profit lock for London-session breaks, and a wider with-trend trail. The London session's first push is often the day's false move: it runs, then fades once New York opens. From 1.09, a position opened in that window is protected by a profit-lock exit once it is meaningfully ahead; positions opened at other times keep the trail, now a further quarter wider when they run with the daily trend. Measured in a Strategy Tester backtest on the same four broker feeds, 2023 to 2026, against the 1.08 machine at a fixed 0.01 lot, this raised net on every one and reduced the average dip below the running equity peak on every one, with the trade-off that the deepest single drawdown episode, while shallower, arrived and cleared faster than before. The full per-broker table is in the manual, chapter 3d.
4. Sizing: the risk facade
Position size is set by one input, the balance behind each 0.01 lot; the account scales the same shape of exposure up or down with that single number. The calibration was measured, not assumed: the boundary between risk levels was set from the drawdown actually produced on the feed with the longest history and the only full flat year in the record, then re-measured on the same feed at the shipped default to confirm the prediction held before it was used. The exact figures for each level, and what each one has produced historically, are in the manual (chapter 3) rather than repeated here, because they are safety information for choosing a setting, not a growth claim.
5. Prop-firm accounts
An account-type switch sets the position size and turns off two of the seven strategies for prop-firm modes. Those two strategies were identified, by measuring the worst single day across the record, as the pair that puts the most loss into the worst days; removing them for prop accounts was decided on that measurement, not by searching for the combination that produced the most favourable backtest. A day-replay simulation that reapplies a firm's daily-loss and maximum-loss rules to the record's own trading days was used to check the prop sizing against real limits before it shipped; the pass-rate table and the rule-guard mechanics are in the manual, chapters 3a and 5a.
6. Out-of-sample: the eight-year test
The seven strategies' constants were measured on 2022-2026 data from three brokers. A fourth broker's archive reaches back to 2018 and was deliberately not used while the constants were being fixed, so it functions as a genuine out-of-sample test rather than more fitting data (backtest, MetaTrader 5 Strategy Tester, real ticks, OANDA GOLD.pro, 2018-06-13 to 2026-09-05, Medium risk level):
- The design held up across the whole eight years, including the quiet gold years it was never tuned on.
- The record is uneven: a small part of the total return was earned from 2018 through the end of 2024, and most of it arrived from 2025 onward, a period in which gold moved from about 2,658 to about 4,430.
- Both the long side and the short side of the machine were profitable over the full eight years on this feed. A longs-only variant looked better on every risk measure in the pre-2025 sub-period, but was rejected as a default because it fits that sub-period specifically — the short side is net positive over the complete record, and disabling it permanently would bake a single macro view into the product. It ships as a visible switch instead of a default.
- The record includes long stretches — up to about two years — without a new equity high. This is stated here because it is what a headline return compresses away: the mechanism worked in every era tested, but it is a trend-harvesting machine, not a smooth one.
7. What was tested and rejected
So the reader knows what is not in the box, and why:
- A volatility-regime gate. A self-calibrating filter based on where the daily trading range sits relative to its own recent history looked strong when every era was pooled together, but the same range bucket flipped from good to bad to very good across three different multi-year eras, and the one bucket that stayed consistently unhelpful had no identifiable market mechanism behind it. A pattern that only holds when the eras are pooled and disagrees with itself era by era is a statistical artefact, not a causal filter, and it is not in the product.
- Longs-only. Covered in section 6 — better in one sub-period, but it bakes a permanent market view into an otherwise direction-agnostic machine, so it ships as a switch rather than a default.
- Removing the stop-lock for the full nine-strategy machine. Covered in section 3 — a clear win for the two excluded strategies, a net loss for the worst broker feed on the shipped seven.
- Per-position profit ratchets and basket-level profit capture. A range of retrace thresholds, floors and basket take-profit or basket-trailing rules were tested against the plain trail. Every setting tried lost money compared with letting the trail run, on both the rebuild and the reference machine it was measured against. The conclusion drawn: the open-profit spikes that retreat before a position closes are the price of the tail that eventually pays, not money left on the table.
- Per-tick trailing. Covered in section 3 — moves exits earlier by a couple of minutes on average and changes almost nothing in aggregate; the cheaper one-minute-close trail ships instead.
8. Why results differ by broker
The same machine, run in the same Strategy Tester backtest on the same window (2025-07-01 to 2026-09-07) on four different live brokers (Fusion, Vantage, BlackBull, Pepperstone; section 0), produces different net and different drawdown. The entries are closely related across feeds; what differs is the cost of getting filled and stopped — spread and execution. A percentage-of-price bracket does not remove that difference, it only keeps it proportional to the price level rather than letting it drift as gold's price changes over the years. This is why every figure in this note and in the listing names its broker and its window, and why the published claim is always the worst of the qualifying live feeds rather than the most favourable one.
9. Limits
- The machine earns its return in trending gold and stands aside, relatively speaking, in flat multi-year stretches — the eight-year test (section 6) shows both kinds of period without excluding either.
- A hedging account is required. On a netting account the strategies' independent positions cannot be tracked reliably, and the EA prints a notice rather than guessing.
- Results differ materially between brokers (section 8); the published figures always state which broker and which window they come from.
- The figures throughout this note are Strategy Tester results on real tick archives. They do not represent trading on a live account and do not predict future performance.
Appendix — version history and how each change was proved
Every change below was proved deal for deal in a Strategy Tester backtest, real ticks (Pepperstone and the other feeds named in the sections above), 2025 to 2026, before it shipped.
| version | change | proof |
|---|---|---|
| 1.00 | product build from the seven-strategy research engine | fixed-lot parity: 1,293 fills, entry match 1.0000, net matched to the cent |
| 1.01-1.03 | internal constant and research-only controls exposed as switchable knobs, all off by default | defaults reproduce the prior version deal for deal on a real-tick window before each release |
| 1.04 | a scheduling fix so expired orders are not repeatedly evaluated while the market is closed | reproduces the version before it deal for deal on a real-tick window |
| 1.05 | prop-firm rule group added (daily loss, maximum loss, profit target, Friday close), all off unless a number is entered | defaults reproduce the version before it deal for deal; each rule fires at its intended trigger in a functional test |
| 1.06 | account-type switch for prop-firm sizing and the two-strategy exclusion (section 5) | personal mode reproduces the version before it deal for deal; each prop mode reproduces the strategy-off configuration it is built from, to the cent |
| 1.07 | wider trail on four strategies (section 3.1) | shipped defaults reproduce the tested wide-trail configuration deal for deal on an independent real-tick window |
| 1.08 | trend-conditioned trail width (section 3.1) | shipped defaults reproduce the tested trend-conditioned configuration deal for deal on the same independent window |
| 1.09 | London-session profit lock and wider with-trend trail (section 3.1) | shipped defaults reproduce the tested configuration deal for deal on the same independent window |
Every figure in this note names its feed and window; the compiled binary that produced each row is recorded by its hash in the product manifest.