Gold market conditions, month by month
Some months reward breakouts. Others take them back. This page measures, for every month since November 2022, how gold actually traded: how far it moved, how much of that movement was trend rather than back-and-forth, and how often a break of an important price level kept going. It describes the market. It contains no trading results.
The last six months, day by day
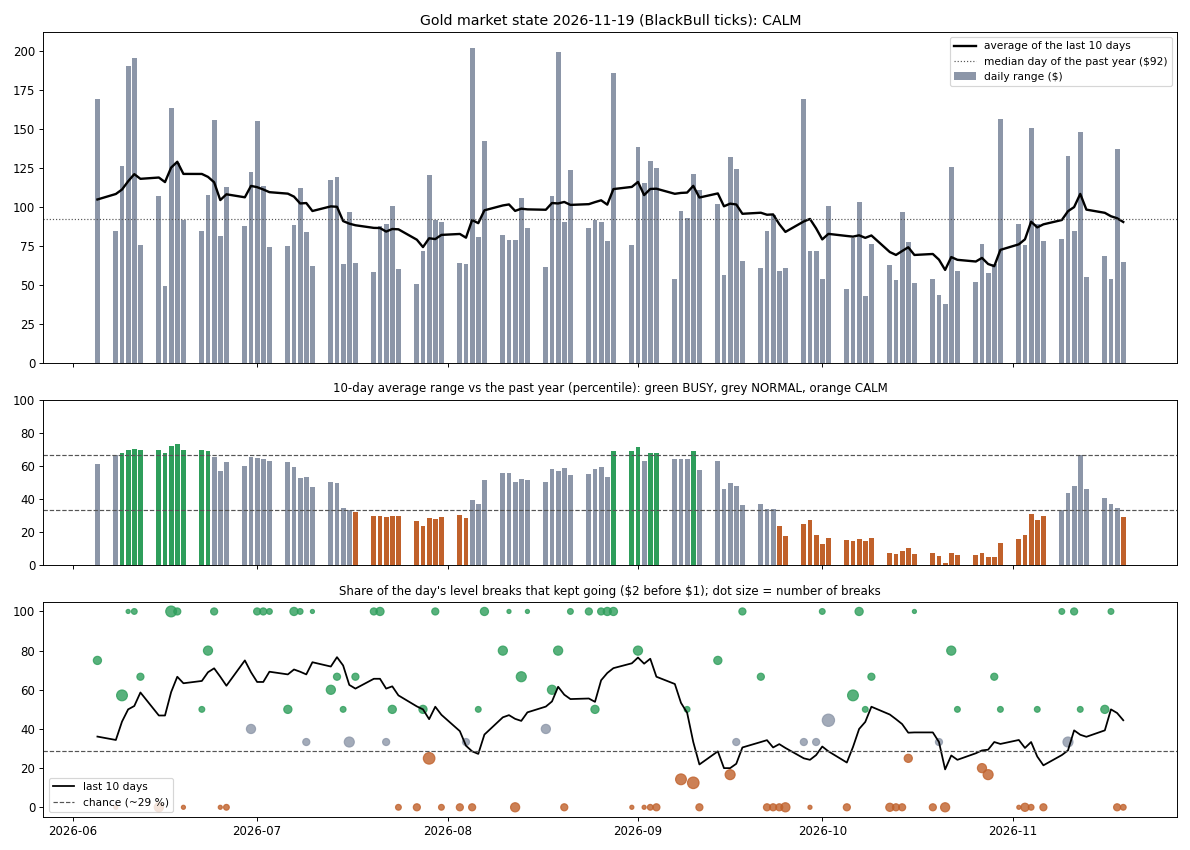
- Top: how far gold moved. Each grey bar is one trading day; its height is the distance from the day's low to its high, in dollars. The black line is the average of the last 10 days and the dotted line is a normal day of the past year. Above the dotted line gold has been moving more than usual, below it less.
- Middle: busy or calm. Where the 10-day average stands among the days of the past year: green is busier than two thirds of the year, orange calmer than two thirds, grey in between.
- Bottom: did breaks of important levels keep going? Each dot is one day: its height is the share of that day's breaks that kept going, its size the number of breaks. With only a few breaks a day the dots jump between 0 and 100 %, so read the black line, which counts the last 10 days together. Above the dashed chance line, breaks kept going more often than random movement would give; below it, they were mostly taken back.
- The date in the chart's title is the last day included. The chart describes what happened; it does not forecast.
How it is measured
- Data. Every tick of BlackBull Markets gold (XAUUSD) price history in MetaTrader 5, on the broker's server clock.
- Important levels. The previous day's high and low, and the nearest swing high and swing low on the 1-hour and 4-hour charts that price has not yet broken. These are the levels where many traders keep their stop orders.
- Follow-through. At the exact tick a level breaks, we simulate a trade in the direction of the break, paying the spread and a commission of $0.06 per ounce. The break counts as followed through when price runs $2 further before it pulls back $1. Only breaks that settle within two hours are counted.
- Chance level. If price moved at random, about 29 % of breaks would follow through, because the target is twice as far as the pullback and the spread is paid at entry.
- Character of the month.
- Breakouts followed through: 50 % or more of the breaks kept going.
- Breakouts mostly reversed: 30 % or less kept going; breaks were usually taken back.
- Mixed: in between.
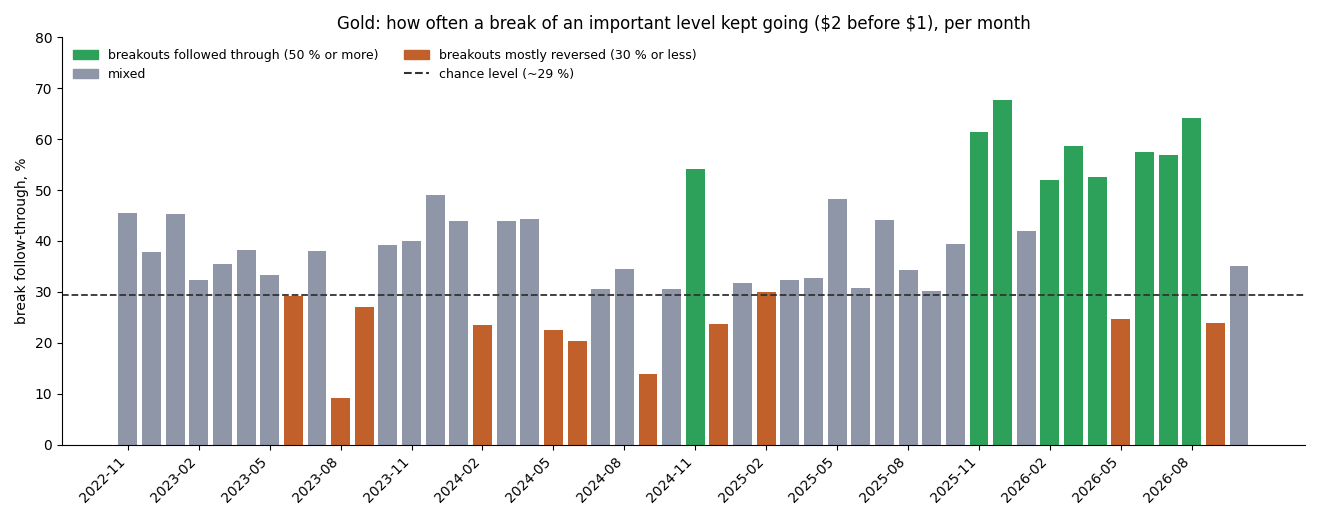
- In the chart, green bars are months where breakouts followed through, orange bars months where they mostly reversed, grey bars mixed months; the dashed line is the chance level.
- Other columns. Average daily range and median hourly range in dollars; trend days = share of days whose net move was at least 60 % of the day's range; persistence = how strongly 15-minute moves carried on over four hours (above 1 trending, below 1 back-and-forth).
What the record shows
From November 2025 to August 2026, eight of ten months had breakouts that followed through: gold's large, news-driven swings carried on after important levels broke. Before that, most months sat close to the chance level. Some months, such as August 2023, September 2024 and September 2026, took most breaks back. The picture has cooled since: in September 2026 only 24 % of breaks kept going, October 2026 was mixed (35 % of 74 breaks kept going), and its average daily range, $72, was the lowest of the past twelve months. November 2026 so far (to the 19th) is mixed as well: 34 % of 35 breaks kept going. Gold moved further than in October, with an average daily range of $94, about a normal day of the past year, and its 15-minute moves carried on more than in any month this year; in the last few days it turned calm again.
| Month | Gold close ($) | Avg daily range ($) | Median hourly range ($) | Trend days (%) | Persistence | Level breaks | Follow-through (%) | Character |
|---|---|---|---|---|---|---|---|---|
| 2026-11 (partial) | 3,736.78 | 93.7 | 14.47 | 36 | 1.17 | 35 | 34 | Mixed |
| 2026-10 | 3,876.80 | 71.6 | 12.40 | 23 | 0.78 | 74 | 35 | Mixed |
| 2026-09 | 4,157.74 | 97.4 | 15.82 | 32 | 0.92 | 67 | 24 | Breakouts mostly reversed |
| 2026-08 | 4,446.40 | 103.8 | 15.76 | 33 | 1.08 | 67 | 64 | Breakouts followed through |
| 2026-07 | 4,046.68 | 89.2 | 13.84 | 44 | 0.97 | 74 | 57 | Breakouts followed through |
| 2026-06 | 4,007.56 | 112.6 | 17.34 | 36 | 0.99 | 61 | 57 | Breakouts followed through |
| 2026-05 | 4,540.03 | 103.4 | 16.64 | 38 | 0.91 | 65 | 25 | Breakouts mostly reversed |
| 2026-04 | 4,622.63 | 110.4 | 18.67 | 24 | 0.94 | 61 | 53 | Breakouts followed through |
| 2026-03 | 4,669.01 | 183.7 | 27.57 | 32 | 0.90 | 58 | 59 | Breakouts followed through |
| 2026-02 | 5,280.27 | 175.3 | 24.81 | 50 | 0.85 | 50 | 52 | Breakouts followed through |
| 2026-01 | 4,882.99 | 148.6 | 18.26 | 36 | 0.95 | 69 | 42 | Mixed |
| 2025-12 | 4,318.68 | 75.8 | 12.36 | 23 | 0.93 | 71 | 68 | Breakouts followed through |
| 2025-11 | 4,239.81 | 80.0 | 14.11 | 35 | 0.92 | 52 | 62 | Breakouts followed through |
| 2025-10 | 4,003.54 | 111.8 | 17.75 | 39 | 0.94 | 66 | 39 | Mixed |
| 2025-09 | 3,858.72 | 53.6 | 8.95 | 32 | 1.01 | 63 | 30 | Breakouts mostly reversed |
| 2025-08 | 3,448.11 | 38.2 | 6.30 | 29 | 0.88 | 67 | 34 | Mixed |
| 2025-07 | 3,290.80 | 44.0 | 6.79 | 39 | 0.97 | 68 | 44 | Mixed |
| 2025-06 | 3,302.83 | 53.7 | 9.20 | 29 | 0.95 | 65 | 31 | Mixed |
| 2025-05 | 3,291.07 | 77.0 | 11.42 | 41 | 1.18 | 60 | 48 | Mixed |
| 2025-04 | 3,288.54 | 84.6 | 13.45 | 38 | 0.95 | 58 | 33 | Mixed |
| 2025-03 | 3,123.21 | 36.2 | 6.45 | 38 | 0.78 | 65 | 32 | Mixed |
| 2025-02 | 2,858.85 | 44.0 | 6.69 | 30 | 0.90 | 60 | 30 | Breakouts mostly reversed |
| 2025-01 | 2,800.69 | 30.0 | 5.01 | 46 | 0.86 | 63 | 32 | Mixed |
| 2024-12 | 2,624.35 | 34.4 | 5.36 | 29 | 1.07 | 59 | 24 | Breakouts mostly reversed |
| 2024-11 | 2,650.41 | 43.8 | 6.49 | 43 | 1.24 | 59 | 54 | Breakouts followed through |
| 2024-10 | 2,743.35 | 27.7 | 5.33 | 44 | 0.97 | 62 | 31 | Mixed |
| 2024-09 | 2,633.54 | 31.7 | 4.84 | 29 | 0.81 | 65 | 14 | Breakouts mostly reversed |
| 2024-08 | 2,503.26 | 37.7 | 5.58 | 27 | 0.91 | 64 | 34 | Mixed |
| 2024-07 | 2,447.31 | 34.3 | 4.89 | 44 | 0.90 | 62 | 31 | Mixed |
| 2024-06 | 2,325.40 | 32.6 | 4.57 | 65 | 1.13 | 64 | 20 | Breakouts mostly reversed |
| 2024-05 | 2,329.45 | 34.8 | 5.20 | 39 | 0.88 | 62 | 23 | Breakouts mostly reversed |
| 2024-04 | 2,285.97 | 43.5 | 6.67 | 18 | 0.92 | 63 | 44 | Mixed |
| 2024-03 | 2,232.80 | 30.3 | 3.90 | 40 | 1.08 | 41 | 44 | Mixed |
| 2024-02 | 2,044.19 | 19.1 | 2.70 | 14 | 1.20 | 68 | 24 | Breakouts mostly reversed |
| 2024-01 | 2,039.10 | 22.5 | 3.45 | 14 | 0.91 | 66 | 44 | Mixed |
| 2023-12 | 2,062.77 | 30.1 | 3.59 | 30 | 1.29 | 57 | 49 | Mixed |
| 2023-11 | 2,035.94 | 20.4 | 3.05 | 41 | 0.95 | 55 | 40 | Mixed |
| 2023-10 | 1,983.79 | 24.1 | 3.57 | 32 | 0.94 | 61 | 39 | Mixed |
| 2023-09 | 1,848.62 | 15.8 | 2.19 | 38 | 1.02 | 63 | 27 | Breakouts mostly reversed |
| 2023-08 | 1,940.05 | 16.0 | 2.44 | 30 | 0.84 | 77 | 9 | Breakouts mostly reversed |
| 2023-07 | 1,964.72 | 19.1 | 2.84 | 24 | 0.98 | 63 | 38 | Mixed |
| 2023-06 | 1,918.80 | 22.6 | 3.10 | 23 | 1.12 | 72 | 29 | Breakouts mostly reversed |
| 2023-05 | 1,962.24 | 27.0 | 3.68 | 39 | 1.03 | 66 | 33 | Mixed |
| 2023-04 | 1,989.62 | 29.5 | 4.05 | 32 | 1.09 | 55 | 38 | Mixed |
| 2023-03 | 1,969.48 | 31.5 | 4.35 | 48 | 0.92 | 65 | 35 | Mixed |
| 2023-02 | 1,826.39 | 24.2 | 3.77 | 25 | 1.11 | 74 | 32 | Mixed |
| 2023-01 | 1,928.02 | 24.7 | 4.02 | 24 | 0.97 | 75 | 45 | Mixed |
| 2022-12 | 1,823.75 | 23.8 | 3.38 | 52 | 1.04 | 58 | 38 | Mixed |
| 2022-11 | 1,768.47 | 25.1 | 3.74 | 32 | 1.28 | 77 | 46 | Mixed |
Source: BlackBull Markets XAUUSD real tick history (MetaTrader 5). Last data day: 2026-11-19. No trading results.
Which kind of month suits which system
Our gold systems do not all want the same month. We compared each system's monthly backtest result with the month's character in the monthly table above (MetaTrader 5 Strategy Tester, real ticks, BlackBull Markets, default settings, the 12 to 13 complete months from October 2025 to October 2026). That is a short record, so read these as tendencies, not rules.
- Swing-breakout systems (Heron Gold, Wren Gold) earn most of their profit from a few breakouts they hold for hours. Their good months were the months when gold moved far; whether most breaks followed through mattered much less, because one big run pays for many small stops.
- Quick breakout systems (Switchboard) take many short trades with a fixed target. Their good months were the months when breaks kept going (high follow-through), more than the months when gold simply moved far.
- Swift Gold sits between the two: its good months were the months when gold moved far and breaks kept going at the same time.
- Dunlin Gold works the other way round. It trades orderly, range-like stretches and stands back when gold turns rough. Its better months tended to be the months when breaks were taken back: in October 2026, a mixed month with the calmest days of the year, it had one of its better months while the breakout systems were roughly flat.
That is why a breakout system and Dunlin Gold can sit on one account: the months that are hard for one tend to suit the other. The "How the EAs fit together" page shows how much their trades overlap.
The long view: gold against its long-run trend
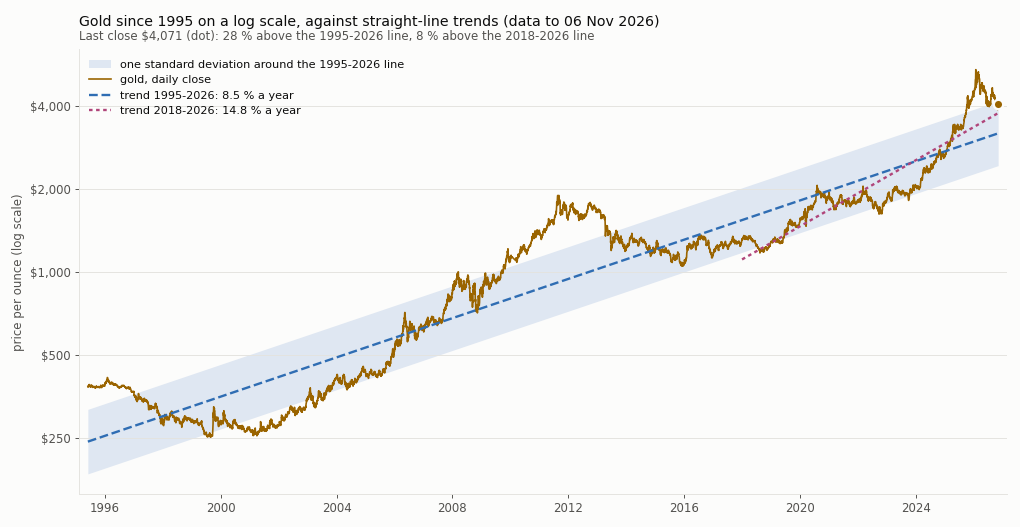
On a logarithmic price scale, growth at a steady percentage each year draws a straight line. This chart shows gold's daily close since June 1995 on such a scale, with two straight-line trends fitted to the price history.
- The blue dashed line is fitted to the whole history from 1995. Along it, gold grew about 8.5 % a year. The shaded band is one standard deviation around it: most of the time, gold traded inside it.
- The pink dotted line is fitted from 2018 only. It is steeper, about 14.8 % a year, because the last eight years rose faster.
- From late 2025 gold rose far above both lines. At its highest close, on 28 January 2026, it was about 81 % above the blue line.
- Since then it has fallen back. On 6 November 2026 it closed at $4,071: about 28 % above the blue line and about 8 % above the pink line.
- Where "the trend" lies depends on the years used to draw it. That is why both lines are shown.
- The chart describes where gold has been relative to its own history. It does not forecast where it goes next. Data: OANDA gold daily closes from June 1995 to 7 October 2026, continued to 6 November 2026 with BlackBull Markets daily closes (on 456 days where both exist, the two differ by $0.58 at the median).
What moves gold most
Measured on 17 years of IC Markets gold daily bars (2009-2026) and 10 years of hourly bars (2016-2026). "x" compares with an average day or, for a release hour, with the same hour on days without a major US release. It describes what happened; it is not a forecast.
- The Fed decision is the biggest scheduled event. Its release hour moves gold about five times a normal hour; the US jobs report and US inflation follow at about two to two and a half times.
- The biggest days are rarely on the calendar. Falls after records (2013, 2020, 2025, 2026), the COVID-19 panic, Brexit, a new Fed chair and wars moved gold far more than any scheduled release.
- War does not always lift gold. In 2026, when war pushed oil and expected interest rates up, gold fell.
Scheduled releases
| Release | Times measured | Release hour vs a normal hour | Release day vs an average day |
|---|---|---|---|
| Fed rate decision | 96 | 5.3x | 1.3x |
| US jobs report (payrolls) | 124 | 2.5x | 1.2x |
| US inflation (CPI) | 118 | 2.1x | 1.1x |
| US retail sales | 126 | 1.5x | 1.0x |
| US GDP (advance) | 53 | 1.4x | 1.0x |
| US ADP employment | 107 | 1.3x | 1.0x |
| US jobless claims (weekly) | 283 | 1.3x | 1.0x |
| US producer prices (PPI) | 112 | 1.3x | 1.0x |
The busiest days since 2009
| Date | vs an average day | Gold that day | What happened |
|---|---|---|---|
| 2026‑01‑30 | 10.9x | fell 9.0 % | Kevin Warsh named as next Fed chair |
| 2020‑03‑26 | 7.4x | rose 0.8 % | COVID-19: US stimulus and record jobless claims |
| 2013‑04‑15 | 7.2x | fell 9.1 % | Gold crash (largest two-day fall in 30 years) |
| 2026‑01‑29 | 7.0x | fell 0.9 % | Record high near $5,600 on US-Iran war fears, then reversal |
| 2026‑02‑02 | 6.9x | fell 4.6 % | Aftershocks of the 30 January crash |
| 2020‑03‑16 | 6.7x | fell 1.2 % | COVID-19: Fed emergency cut to zero |
| 2016‑06‑24 | 5.5x | rose 4.7 % | Brexit referendum result |
| 2011‑09‑26 | 5.4x | fell 0.9 % | Sell-off after the Fed's 'Operation Twist' and margin increases |
| 2025‑10‑21 | 5.4x | fell 5.3 % | Gold's largest one-day fall since 2013 |
| 2011‑09‑23 | 5.2x | fell 5.7 % | Sell-off after the Fed's 'Operation Twist' and margin increases |
| 2026‑03‑23 | 5.1x | fell 2.0 % | Hawkish Fed and Middle East war: gold briefly below $4,200 |
| 2020‑03‑13 | 5.1x | fell 3.1 % | COVID-19 market crash |
| 2020‑08‑11 | 5.0x | fell 5.7 % | Gold record, then the largest fall in seven years |
| 2020‑02‑28 | 4.9x | fell 3.5 % | COVID-19 market crash |
| 2020‑03‑12 | 4.9x | fell 3.5 % | COVID-19 market crash |
Major world events
| Date | Event | That day | Busiest day of that week | Gold over the week |
|---|---|---|---|---|
| 2026‑01‑28 | US-Iran war fears, gold record near $5,600 | 3.7x | 10.9x | fell 4.5 % |
| 2026‑01‑30 | Kevin Warsh named as next Fed chair: gold's largest one-day fall since 1983 | 10.9x | 10.9x | fell 11.0 % |
| 2013‑04‑15 | Gold crash (largest two-day fall in 30 years) | 7.2x | 7.2x | fell 5.3 % |
| 2020‑03‑16 | COVID-19: Fed emergency cut to zero | 6.7x | 6.7x | fell 2.1 % |
| 2016‑06‑24 | Brexit referendum result | 5.5x | 5.5x | rose 5.2 % |
| 2025‑10‑21 | Gold's largest one-day fall since 2013 | 5.4x | 5.4x | fell 8.6 % |
| 2026‑03‑19 | Fed holds rates and signals no cuts in 2026 | 4.3x | 5.1x | fell 6.5 % |
| 2020‑03‑09 | COVID-19 and oil price crash | 2.5x | 5.1x | fell 8.7 % |
| 2020‑08‑11 | Gold record, then the largest fall in seven years | 5.0x | 5.0x | fell 2.1 % |
| 2026‑03‑02 | Middle East war, Iran closes the Strait of Hormuz | 2.0x | 4.8x | fell 2.0 % |
| 2011‑08‑08 | US credit rating downgraded by S&P | 1.8x | 4.0x | rose 5.1 % |
| 2020‑11‑09 | First COVID-19 vaccine results | 4.0x | 4.0x | fell 3.2 % |
| 2022‑02‑24 | Russia invades Ukraine | 3.9x | 3.9x | rose 1.0 % |
| 2011‑09‑06 | Swiss National Bank caps the franc | 2.6x | 3.7x | fell 4.5 % |
| 2020‑01‑06 | US strike kills Iranian general Soleimani | 1.8x | 3.6x | rose 0.7 % |
| 2016‑11‑09 | US presidential election (2016) | 3.5x | 3.5x | fell 3.7 % |
| 2025‑04‑03 | US 'Liberation Day' tariffs | 2.8x | 3.2x | fell 1.6 % |
| 2025‑04‑09 | US tariff pause | 3.2x | 3.2x | rose 8.3 % |
| 2019‑08‑05 | US-China trade war escalation (yuan above 7) | 2.4x | 2.8x | rose 3.9 % |
| 2024‑11‑06 | US presidential election (2024) | 2.8x | 2.8x | fell 5.3 % |
Source: IC Markets XAUUSD daily and hourly bars (MetaTrader 5); release times from the ForexFactory and MetaTrader economic calendars; event dates from news reports.
Updates
The table is extended at the start of every month. The current month is shown as partial until it is complete.